
This guide lists 40+ ad metrics (CPM, CPC, CTR, ROAS, I2C and more), explains when to use each metric, and gives a quick checklist (PNG) to spot common mistakes in tracking KPIs. Whether you’re launching Facebook campaigns or switching to display advertising, this guide will walk you towards data-driven decisions.
Ad metrics guide summary
| Chapter | Key Takeaways |
|---|---|
| Ad Metrics Basics | Ad metrics are data points to measure performance. |
| Core Metrics | Key metrics include CPM, CTR, conversion rate & cost, bounce rate, CAC, and customer lifetime value. |
| Platform-Specific Insights | Google Ads, Adsterra, Facebook Ads, and affiliate networks each count metrics differently. We make all things clear! |
| Choosing The Right Metrics | Avoid dull numbers. Match them to your goals: visibility or publicity, engagement, leads, or revenue. |
| Performance Optimization Tools | Overview: Google Analytics, Looker Studio, Facebook Ads Manager, and more solutions to boost campaign results and analyze the outcome. |
| FAQs | Clear answers and definitions: ROAS, KPIs, the 5 M’s of advertising, and ad metrics tracking mistakes. |
| Bonus Checklist– click to jump to this section | Common advertising metrics tracking mistakes even pros make and a checklist to avoid them. |
The foundation: Understanding advertising metrics
What are ad metrics?
Ad metrics are measurable units of data that show how your ad campaigns are performing. Advertising metrics can reflect:
- How many people viewed your message (ad impressions)
- The number of clicks compared to overall impressions (click-through rate or CTR)
- How much you pay for a click, one thousand impressions, or a conversion
- Money you earned (ROAS, revenue on ad spend, literally per dollar spent)
- Whether you are profitable (ROI, return on investment)
Advertising metrics connect your marketing efforts to business results — leads, sales, and long-term growth. Campaign performance can even be exposed
Why tracking metrics drives campaign success
Marketers who track the right ad metrics in the right situation achieve success because clarity leads to better:
- Budget planning (no wasted spend)
- Campaign optimization (focus on what converts, and cut off what eats budgets)
- Audience targeting (finding the best segments of traffic)
- Creative decisions (finetune your messages and visuals)
What happens if you don’t track ad metrics
Let’s take an example. If you don’t measure your Facebook Ads campaign, you could drain budgets on a campaign that looks great — but doesn’t sell or doesn’t hit another goal. That’s why tracking your CPR (cost per result) or the conversion rate on Facebook Ads Manager is vital.
Tracking is essential for digital marketers to stay competitive. Both beginners and pros maximize returns across every channel with clear measurements, from paid ads on Google to affiliate traffic and display advertising campaigns on networks like Adsterra.
Core advertising metrics every marketer must master
Data-powered ad campaigns track more than just impressions or views. How about a breakdown of key advertising metrics? You’ll then be able to apply these across platforms — from Google Ads and Facebook Ads to display ad networks like Adsterra.
Each metric is purpose-driven. Some tell you about your visibility, others about cost-efficiency, and some reveal campaign success.
1. Cost-based metrics
Cost-based metrics help evaluate ad spending, control budgets, and react quickly if you exceed your limits.
| Name | What it measures | Meaning |
|---|---|---|
| Cost per Mille (CPM) | Cost per 1,000 ad impressions | Evaluate ad reach and brand awareness per campaign |
| Cost per Click (CPC) | How much you pay for each user click on an advertisement | Use it for traffic campaigns where clicks matter |
| Cost per Action (CPA) | Price of each desired action (signup, purchase) | Best for performance-based campaigns |
| Cost per Lead (CPL) | Price of every lead acquired | Critical for B2B and lead-generation campaigns |
| Customer Acquisition Cost (CAC) | Total cost of one customer acquisition | Use CAC to evaluate overall marketing efficiency |
| Cost per View (CPV) | Used in video ads to measure cost per each view | Relevant for YouTube, TikTok or Facebook video adverts |
Note: you will sometimes see the Cost Per Action and Cost Per Acquisition used as synonyms because if you acquire an action, you get a desired result. However, CAC can also be helpful when you finetune traffic and are willing to measure how much you pay for a customer, not per target action.
Next, we’ll observe the key formulas to help you calculate price-related KPIs.
Cost-based metrics calculations
| Metric | Formula to calculate |
|---|---|
| CPM | (Total Campaign/Keyword/Ad Set Cost ÷ Impressions) × 1,000 |
| CPC | Total Spend per Campaign/Keyword/Ad ÷ Total Clicks |
| CPA | Total Spend per Campaign/Keyword/Ad Set ÷ Total Conversions |
| CPL | Total Spend per Campaign/Keyword/Ad Set ÷ Leads Acquired |
| CAC | Total Spend per Campaign/Keyword/Ad Set ÷ Customers Acquired |
| CPV | Total Spend per Campaign/Keyword/Ad Set ÷ Total Video Views |
Note:
1. Every platform can measure the same metrics in its way. For example, TikTok’s CPV will charge you per view when a user watches at least 2 or 6 seconds of the video.
2. High CPM or CPC isn’t good or bad. These are the markers of how relevant your campaign is and how heavy the competition is.
2. Engagement and conversion metrics
Engagement rate is the percentage of people who read content, navigate your site, and don’t leave right after coming. Conversion rates show the percentage of people who performed a desired action you set: app downloads, installations, registrations, purchases, etc.
| Metric name | What it measures | Meaning |
|---|---|---|
| Click-Through Rate (CTR) | Percentage of clicks out of total views | Shows how well your ad content and creatives engage audiences |
| Conversion Rate (CR) | Percentage of users who complete a desired action | Tracks how well your traffic converts into results |
| Engagement Rate | Percentage of users who interact with ads | Crucial for social media platforms (e.g., Facebook and YouTube) |
| Bounce Rate | Percentage of users who left the landing page too fast | Shows if a landing page matches user intent |
| Form Submission Rate | Percentage of users who filled a form | Vital for lead generation campaigns |
| Sign-ups | Number of new user registrations or sign-ups | One of the main metrics for app and utility ads |
Pro clue from Mikhail Zhukov, Adsterra’s Head of CPM and traffic acquisition expert:
If your CTR (dividing total clicks to total impressions) is high but the conversion rate is poor, check ad creatives. Ad messages may be overpromising. The same for high CTR and terrible bounce rate, but in this case, you need to check your landing page’s performance metrics, as well (page load speed, lead forms, all basic information).Experts in Google PPC marketing advise controlling the click-to-conversion ratio. It sometimes happens when you get lots of bot clicks with zero conversions, when targeting specific keywords. Set alarms or automated rules to pause campaigns when this occurs.
Want to test real metrics in real campaigns? Launch your first campaign with top-class traffic!
How to calculate engagement & conversions
| Metric | Formula to calculate |
|---|---|
| CTR (Click-Through Rate) | (Total Clicks ÷ Total Impressions) × 100 |
| Engagement Rate | (Engagements ÷ Impressions or Reach) × 100 |
| Bounce Rate | (Single-Page Sessions ÷ Total Sessions) × 100 |
| Conversion Rate | (Total Conversions ÷ Total Visitors) × 100 |
| Form Submission Rate | (Form Submissions ÷ Visitors) × 100 |
| Sign-Up Rate | (Total Sign-Ups ÷ Visitors) × 100 |
Revenue and profitability metrics
Revenue metrics help assess if your investment in ad campaigns have been profitable. The following metrics are most common for digital marketers.
| Name | What it measures | Meaning |
|---|---|---|
| Return on Ad Spend (ROAS) | Revenue per ad spend or per dollar spent | The key marker of a campaign profitability |
| Return on Investment (ROI) | How much money you made, net of all expenses | The key marker of your marketing performance |
| Ad Revenue Metrics | Total revenue generated from ads | Useful for publishers and affiliates, usually includes eCPM |
| Customer Lifetime Value (CLV) | Total revenue a customer generates over time | Helps align campaign goals with long-term business growth |
| Revenue per Mille (RPM) | Revenue per 1,000 page views (mainly on Google Adsense) | Metrics ensure monetization efficiency for display advertising |
The difference between ROAS and ROI in marketing
ROAS and ROI measure marketing campaign profitability but there are differences in these metrics. You calculate ROAS to see how much you spend on ads exactly. Example: If you have spent $500 on Facebook ads and earned $2,000, your ROAS is 4.0.
Return on Investment (ROI) includes all costs (staff wages, paid services, etc.) ROI shows your net profit from all of the investments. Example: Your campaign returns $3,000, but your total cost (ad campaigns + landing page + freelancer work) is $1,200. Then, your ROI is calculated this way: (3000 – 1300) / 1300 = 1.3, or 130%.
Ad performance metrics calculations
| Metric | How it’s calculated |
|---|---|
| ROAS (Return on Ad Spend) | Revenue from Ads ÷ Cost of Ads |
| Advertising Revenue | Total Sum of Earnings from Ad Formats or Offers |
| CLV (Customer Lifetime Value) | Average Purchase Value × Purchase Frequency × Customer Lifespan |
| RPM (Revenue per Mille) | (Estimated earnings ÷ Number of page views) × 1000 |
Behavioral and quality metrics
How to measure user behavior and the cost of user attention? Here’s when you refer to not direct metrics of evaluating how your target audience interacts with ad campaigns. While they’re not related to earnings, they’re vital for measuring advertising efforts and a better understanding of your advertising strategy.
| Metric name | What it measures | Meaning |
|---|---|---|
| Ad Relevance Score / Quality Score | In-house score for relevance | Impacts cost per click and ad placement |
| Ad Fatigue | Declining campaign performance | Shows it’s time to refresh creatives or choose another ad unit |
| User Engagement | Level of interest shown through on-page actions | Helps optimize landing pages and user flow |
| Custom Events | Specific actions and user behaviors (e.g., page scroll) | Detailed funnel tracking in tools like Facebook Ads Manager or Google Analytics (GA4) |
All quality measurements vary if you jump from one marketing platform to another. Facebook ad metrics will track user engagement depending on average social media platforms’ parameters. Google display network will count how unique users interact with ads on websites, which will include alternative behavior patterns. Adsterra provides the I2C (impressions-to-conversions) rates. Other channels will base their calculations on their specifics. But here are the main priciples of assessing if your offer and content resonates with your target audience.
Behavioral and quality metrics calculations
| Metric | Calculation |
|---|---|
| Quality Score (Google) | Google’s score (1–10) is based on expected CTR, ad relevance, and estimated landing page experience |
| Ad Fatigue | No fixed way to count: rising costs per click, low CTR (click-through rates), and high frequency |
| User Engagement | Always relies on channels and events: user session, scroll depth, average reading time, clicks, etc. |
| Custom Events | Number of completed specific actions ÷ Total Visits |
Platform-specific insights: Tailoring metrics to your channels
Advertising metrics stay the same in meaning, how they’re tracked — and what they include — vary by advertising channel. To truly improve campaign performance, you need to fine tune your KPIs according to the channel. Let’s try to do this right now!
Display ad networks’ metrics (Adsterra)
Adsterra operates a set of CPM, CPC, CPA, and Smart CPM pricing models. Ad metrics are flexible, and you will find the right ones based on your campaign goals. Stats reports are available in your account for all active campaigns. Advertisers make informed decisions, reach precise targeting, and manage to lower costs segmenting and filterings stats by: country, placement, region, city, creatives, and more.
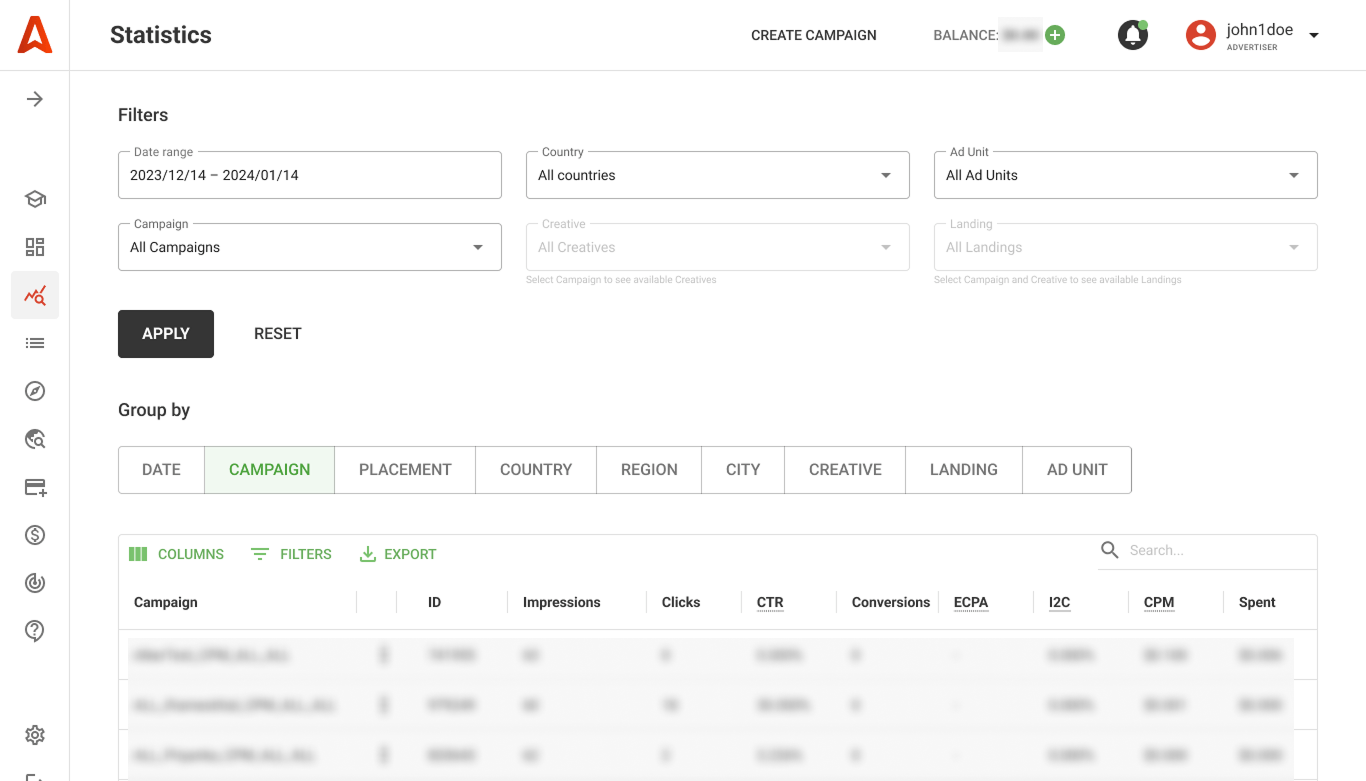
Key metrics for display ads:
- CPM = eCPM [Total Cost / Total Impressions) × 1000]: how much you pay, for 1,000 ad impressions.
- Clicks – the number of times people clicked the ad, used in display advertising campaigns to check cost-efficiency
- CTR – click-through rate that tells if users actually engage after clicking.
- I2C – the impression to conversion ratio
- Conversions – how many users converted into actions
- ECPA – the effective average cost of a conversion (Total Amount Spent / Total Number of Conversions)
It’s possible to predict the CPM rate and budgets when you create a test campaign. Adsterra will evaluate the nearest competitors’ payouts for this traffic and recommend the minimal and the most competitive bid right in your account. This helps measure the cost in advance.
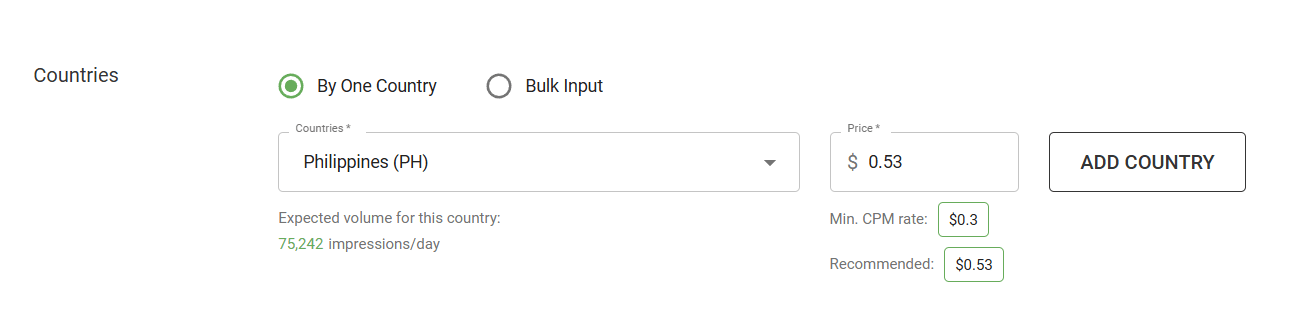
Statistics reports can be extended with a lot more parameters if you add a tracker. You can track marketing budgets with detailed reports according to your key performance indicators and business objectives.
Need help improving media buying strategies? See how to choose the right campaign optimization strategies.
Key affiliate marketing metrics
Affiliate marketing pros heavily rely on performance metrics when running ads. If traffic is cheap and conversions keep coming, they will stay with the selected channel for a long time. Efficient campaigns always earn more then spend.
Affiliates need to monitor organic traffic performance along with paid ads efficiency. Here’s why they use quality metrics (engagement rate and bounces) along with quantity (CTR, CR, etc).
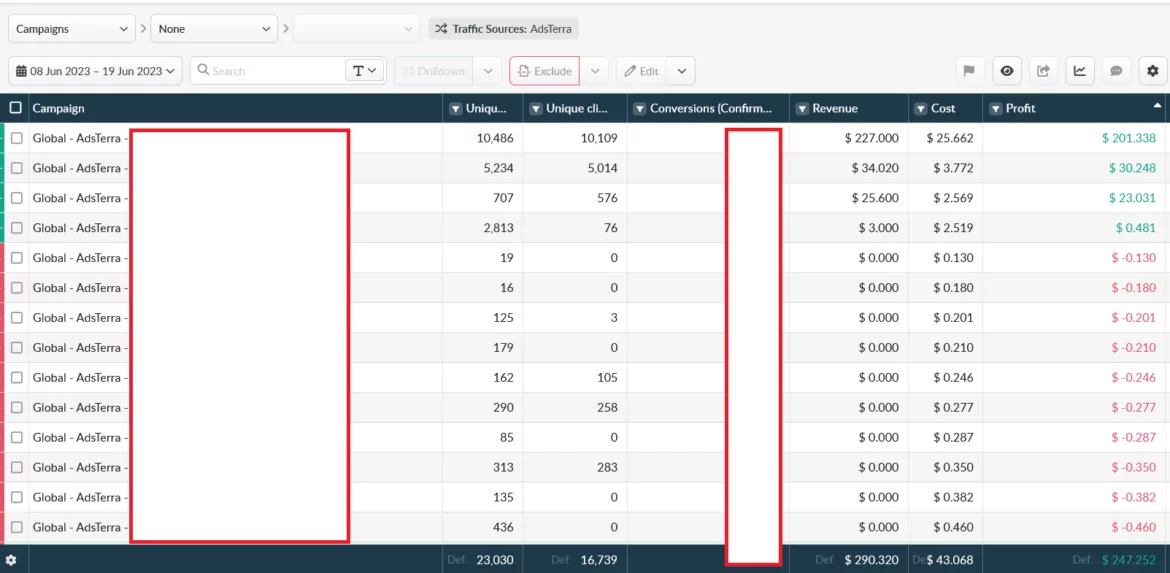
To measure online ad metrics, affiliates typically use tracking solutions. Trackers like Voluum, RedTrack, Keitaro, and others include core ad performance metrics like engagement metrics, CPA and ROI.
Display ad networks like Adsterra offer integration with popular trackers to enrich your stats with vital advertising success metrics and even real-time data. For more info, read about S2S tracking specifics.
You’re able to monitor ad effectiveness metrics for campaigns you create:
- CPA (Cost per Action) – know how much each conversion costs
- ROAS – measure revenue vs. ad spend
- Bounce rate and user engagement – track landing page performance
- Conversion rate – gauge affiliate link effectiveness
- EPC (Earnings Per Click) – see how much revenue is generated on average from one click
- Revenue generated – how much money you gained with a campaign
- ROI and Net Profit – used to align metrics with your real income, excluding money spent
Google Ads: Navigating the core metrics
Google Ads divides its marketing ecosystem into Search, Display, Video, and Shopping — and each has its own rules. For each campaign created, the system allows you to estimate engagement rate (how compelling your ads are) and main cost-effectiveness KPIs.
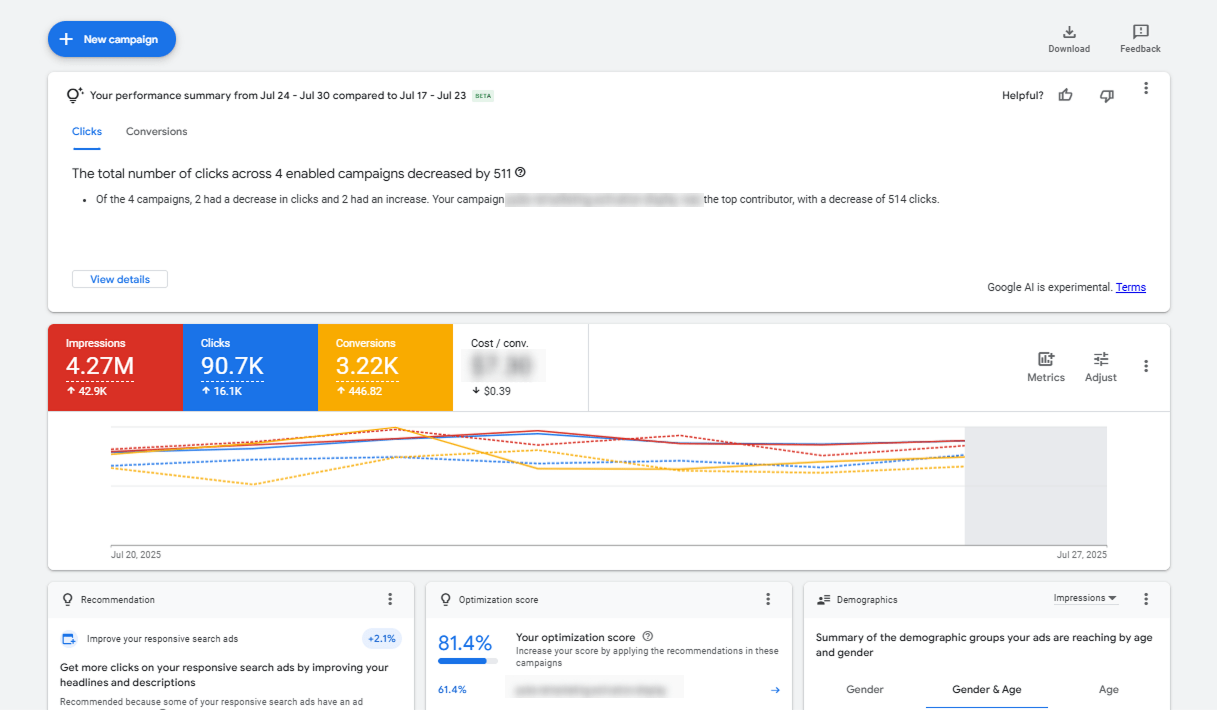
Core Google Ads metrics:
- CTR – typically higher for search ads at 3–5%
- CPC – varies by industry; search ads are pricier compared to display advertising campaigns
- Quality Score – shows relevancy, your ad rank, and CPC (lower CPC comes with quality ads)
- Conversion rate – especially important for purchase-based campaigns
- Impression share – tells you how much of the market you’re reaching
- Cost/Conv – how much you pay for a target action
💡 If your Quality Score is low, expect to pay more for worse placements.
💡 Viewable impr. signals about your ad viewability. An ad is considered viewable when at least 50% of its area is visible for one second (on Google Display Network), or two seconds for video adverts.
Key metrics for Facebook ads: traffic metrics and cost efficiency
Advertisers can track multiple Facebook ad metrics to evaluate your marketing efforts and optimize campaigns to focus on the right audience.
Key Facebook ad metrics explained:
- CTR (All) – includes clicks on any part of the advertisement
- Link clicks – the number of times users clicked
- CTR (Link Click-Through Rate) – clicks that lead to external sites.
- Engagement rate – likes, comments, shares, saves.
- Frequency – how many times the same person sees your ad.
- Video views. 2-3 second continuous video plays, video plays at 25% to 100%, average play time, etc.
- Ad relevance diagnostics – quality ranking, engagement ranking, conversion ranking.
As you can see, Facebook ads analytics serve lots of important ad metrics. Your goal is to keep the engagement rates high while costs per result optimal to balance advertising investment.
The same user may be cheap or costly depending on the geo and location targeting. But Facebook ads will keep you informed of sudden price changes to protect your marketing strategy. To improve performance, advertisers manage versatile filters that make FB ad metrics even more transparent: country, age, gender, placement, region, and more.
Metrics for LinkedIn, Twitter, Instagram, and other social media
Each social media platform adds specific measurements — especially for video ads and mobile ads. In general, all of them allow tracking traffic metrics (brand awareness), engagement, and sales.
Awareness KPIs include: Impressions, CPM, Reach, CTR, Views, View Rate, and so on.
- Engagement markers include: Clicks, Likes, Commenting, Shares, Engagement rate, CPC, and others.
- Lead generation KPIs are: leads, CPL, form completion rates, etc.
Let’s compare unique metrics across popular social networks.
| Social media | Unique Metrics | Campaign Focus |
|---|---|---|
| Lead form opens, Job clicks, Follower growth rate, Profile views | B2B marketing, form submissions | |
| Twitter/X | Engagements, Retweets, Profile visits | Branding, influencer engagement |
| Saves, Shares, Story replies | Engagement-heavy campaigns | |
| TikTok | Watch time, Average view duration, Spark native format, Following Growth Rate, Purchase Rate (Shops) | Video ad engagement |
| YouTube | CPV, Average watch percentage, Subscribers gained | Deep video engagement and subscriptions |
Selecting the right ad metrics for your goals
One of the biggest mistakes marketers make is tracking everything — this means learning nothing.
Not all ad metrics are relevant for every marketing campaign. The secret lies in selecting KPIs that align directly with your business goals. Here’s how to avoid fluff and focus on what really matters.
1. Match measurements to campaign goals
| Campaign Goal | Marketing metrics | Why track? |
|---|---|---|
| Brand Awareness | Impressions, Reach, CPM, Frequency | You want to be noticed. You can estimate how well you embrace website traffic or social media. |
| Engagement | CTR, Engagement Rate, Video Views, Saves | Interaction indicates interest. Focus on actions that show involvement. |
| Lead Generation | Cost per Lead (CPL), Conversion Rate, Form Completion | These show how effectively your ads appear to trigger real intent. |
| Sales & Conversions | CPA, ROAS, Customer Acquisition Cost (CAC), Opt-ins | Match your advertising budget directly to revenue generated. Best for cost effectiveness. |
| Customer Retention | CLV, Repeat Conversions, Email Signups | For post-sale strategies or loyalty campaigns, focus on LTV over time. |
Example: You run Facebook ads for a premium B2B SaaS. It’s better to focus on sign-ups and CAC rather than on CTRs.
2. Avoid tracking KPIs that don’t serve your objectives
Here’s what misaligned measurements look like:
- Measuring ROAS on a brand awareness campaign = you miss out on reach and cool website traffic
- Obsessing over views when targeting the bottom funnel stage (actions) = you get publicity instead of money
- Tracking bounce rate for retargeting campaigns = irrelevant
Stay sharp. Your ad campaign metrics should serve your campaign goals, not clutter your dashboards.
3. Check industry insights and iterate
Once you choose the right metrics, measure against industry benchmarks or your own historical data. Then iterate.
Ask yourself:
- Are we acquiring customers at a desired price?
- Is our click-through rate better compared the last quartile reporting?
- How many users are bouncing off our landing page?
- Do creatives still engage users, or CTRs have dropped?
Digital marketing is about knowing all KPIs but tracking only those that are needed to hit your objectives.
Tracking, analyzing, and optimizing your ad metrics
Monitoring ad metrics isn’t just about collecting data — it’s about making informed decisions that improve campaign performance and return on advertising spend (ROAS).
Three main things are needed for long-term success:
- A clear measurement strategy
- The right tools
- A process for interpreting the results and applying changes
Step 1: Come up with key advertising metrics and systems
After you define key performance indicators (KPIs), build a report with all measurements. You may need to add custom events to your traffic source or analytics suite.
Must-have events in major marketing channels:
- Clicks on call-to-action (CTA) buttons
- Form submissions
- Registrations or opt-ins
- Email captures
- Add-to-cart actions (for online stores)
- Orders, purchases, and transactions
- Scroll depth, time on page, and views of video content (especially for Facebook video ad metrics)
Facebook Ads Manager, Google Analytics, and affiliate tracking solutions can map events to specific advertising sets, creatives, placements, and audience segments.
Step 2: Analyze with context
In digital marketing, you combine metrics for measuring ad campaign effectiveness, looking for context-related insights:
- High CTR with conversion rate? → Landing page might mismatch user intent, or visuals engage audiences but the lander doesn’t.
- High CPC but excellent CR? → Still worth the investment, but you may need to add relevant keywords to your page.
- High bounces with low engagement? → Users might not find your page compelling enough to act.
Pro tip: Segment your data — by device, audience, creatives. You’ll often find ways for improvement: low engagement or quality score problems can hide in specific slices.
Step 3: act and improve
Use your findings to:
- Pause or A/B test underperforming creatives
- Copy an advertising campaign and try alternative bidding or tageting
- Shift budget to high-ROAS advertising sets
- Refine landing pages to match audience expectations
- Retarget users who dropped off before completing the desired action
If you notice CR drops while the CPM/CPC has spiked, it’s time to refresh the offer or its creatives for better results. Read more about Ad Campaign Optimization Techniques.
Key optimization tips
- Update creatives frequently to avoid banner fatigue
- Use UTM tags for better cross-channel tracking
- Revisit your marketing strategy each quarter to realign goals
- Balance investments between awareness and performance campaigns
- Test new advertising units: Social Bar format, Interstitials, Video campaigns, etc.
Improving ad metrics isn’t a one-time task. It’s a continuous loop of testing, measuring, adjusting — and scaling.
Tools and means for ad metrics tracking
Whether you’re optimizing Facebook ad campaigns or acquiring traffic from Adsterra, you need smart solutions to derive actionable insights and control advertising effectiveness. We’ll outline vital systems and services to monitor campaign success.
Advertising platforms’ dashboards (built-in solutions)
| Tool | Best For | Notable Features |
|---|---|---|
| Facebook Ads Manager | Managing and tracking Facebook ads metrics | Custom conversion tracking, A/B testing, audience breakdowns |
| Google Ads | All things search ads, display, and YouTube | Quality Score insights, impression share, keyword-level metrics |
| Adsterra Self-Serve Platform | Launching and managing display ad campaigns | Real-time stats on CTR, CPM, CPC; flexible targeting and formats |
| LinkedIn Campaign Manager | B2B lead-gen and job ads | Tracks form fills, followers, engagement rate |
| Twitter Ads | Real-time engagement tracking | Tracks replies, link clicks, and profile visits |
Analytics platforms
| Tool | Purpose | Key Metrics Tracked |
|---|---|---|
| Google Analytics 4 | Website behavior and traffic metrics | Bounce rate, session time, landing page conversion |
| Mixpanel | Product and funnel analysis | Tracks custom events, user flow, retention |
| Hotjar / Microsoft Clarity | User interaction heatmaps | Understand user behavior, scroll depth, page clicks |
| Segment | Data collection pipeline | Syncs marketing efforts across dashboards |
Optimization & testing tools
| Tool | Primary Use | Bonus Features |
|---|---|---|
| Optimizely / VWO | A/B testing for landing pages and funnels | Tracks uplift in conversion rate, form submissions |
| Unbounce | High-converting landing pages | Built-in analytics for cost efficiency tracking |
| Mailchimp / HubSpot Ads | All-in-one CRM + ad management | Tracks customer acquisition and email sign-ups from ads |
Bonus: Cross-channel analytics & visual dashboards
When having all core results in front of you, it’s easier to get valuable insight on how your ads perform. Here are some of the most-used dashboards to visualize online advertising metrics across channels.
| Service | Use Case | Why Use |
|---|---|---|
| Looker Studio (Google Data Studio) | Custom dashboards building | Merge GA4, Facebook, and other systems |
| Supermetrics | Reporting via spreadsheets | Pull data from 100+ sources |
| AgencyAnalytics | Client reporting for marketing agencies | White-label dashboards for paid ads, incl. Google |
| Adverity | Enterprise-scale marketing analytics powered with AI | Optimize marketing budgets and ROI across social, search, and commerce channels |
| Tableau | Advanced visualization | Great for interactive ad performance reports |
| Microsoft Power BI | Business intelligence for agencies and businesses | Syncs ad data with CRM and financials (unit economics) |
| Amplitude | Product analytics with campaign overlays | Connects behavioral patterns with ad campaigns and product analytics |
How to troubleshoot major issues with digital ad metrics
With so many KPIs out there, you must notice and fix the most important metrics quickly. Here’s a set of tips for common ad campaign pitfalls troubleshooting:
| Issue | Common Red Flags | How to Fix |
|---|---|---|
| Few conversions | High CTR + high bounce rate | Fix the landing page, test CTAs, recheck creatives |
| Rising CPC | low quality score, too narrow target audience | Improve the copy relevance, recheck targeting, ask your Adsterra manager for competitive CPC |
| Ad fatigue | Low CTR + high frequency | Refresh creatives more often, decrease the number of times people can see your ad |
Conclusion
Whether you’re scaling Facebook ads, testing creatives on Google Display Network, or enriching affiliate offers with Adsterra traffic, the right metrics help you:
- Control budgets and don’t confuse impressions with profits
- Find weak targeting segments that need improvement
- Improve campaign performance
- Maximize revenue generated and boost earnings
- Align with real business goals in a selected time period
- Keep a close eye on traffic sources and open new customer markets
Understanding ad metrics is a way to start winning! Your first win starts right now, with the registration.
Advertising metrics FAQ
What are KPIs in advertising?
Key Performance Indicators or KPIs are crucial to measure if a campaign is meeting its objectives. KPIs “indicate” if you overspend, perform great conversion rates, or fail to hit a desired number of leads. Common ad KPIs include CTR, CPA, ROAS, conversion rate, and customer acquisition cost. Each KPI tracks a specific part of your marketing funnel, from reach to revenue, and helps evaluate the effectiveness of your marketing strategy.
What are the 5 M’s of advertising?
The 5 M’s of advertising are: Mission (your objective), Money (your budget), Message (your offer, and how compelling it is), Media (channels like Facebook, Google, Adsterra), Measurement (how you measure success and effectiveness).
What is the ROAS metric for ads?
ROAS (Return on Ad Spend) shows how much revenue you get for every dollar spent on ads. It’s calculated by dividing campaign gains to spending on advertising. For example, if you invest $500 and earn $2,000, your ROAS is 4.0. ROAS helps evaluate the cost efficiency of your ad campaigns.
What is the average CTR in web advertising metrics?
Benchmark data reveal the average CTR for display ads is around 0.35-0.64%; however, data vary heavily depending on the ad network and the industry. Adsterra’s Social Bar delivers 15% to 30% CTRs. Google Ads is proud to have an average click-through rate of 6.6% (as of Wordstream data). CTR is a great metric that shows if people are interested in your message. However, benchmarks only reveal basic data; you can improve these results by ensuring better engagement and relevancy.